Lecture: Data Visualisation - Using Graphs and more to Evaluate and Present your Data

Course Description
When analysing a corpus, a great aid to researchers is the ability to visualise data. What means of visualisation exist and when should they be used? How can specific visualisations be created? Can data representations be misleading?
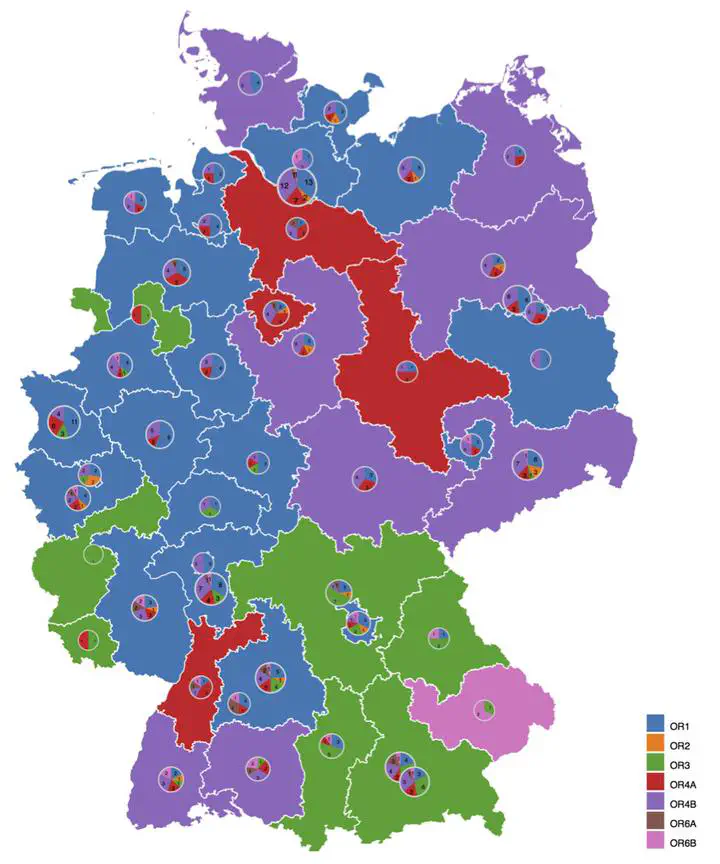
In this course we will discuss these questions. We will begin with basic visualisations such as pie charts, line graphs and histograms, discussing their potentials and pitfalls. As the course progresses, we will move on to more complex visualisation techniques, for example how to use geographic metadata to represent regional language variations on a coloured country map. All these topics will be addressed in interactive exercises in which participants will learn how to create their own visualisations.
Marc Schulder
Research Associate in Computational Linguistics
My research interests include sign languages, natural language processing, and open science.